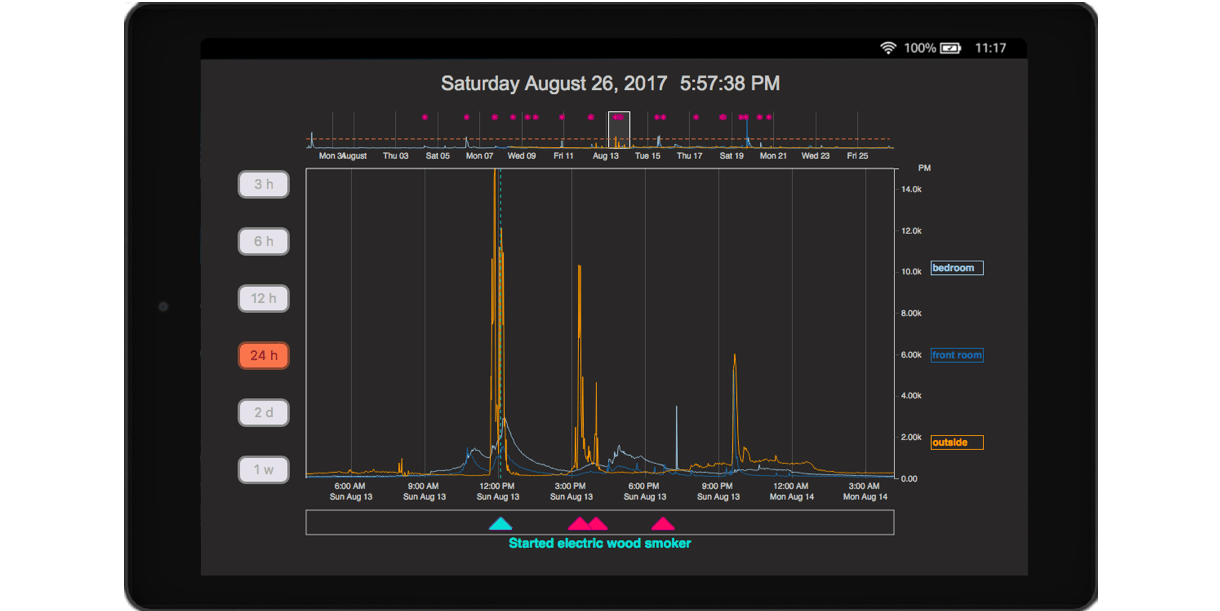
Air quality is important, varies across time and space, and is largely invisible. Pioneering past work deploying air quality monitors in residential environments found that study participants improved their awareness of and engagement with air quality. However, these systems fielded a single monitor and did not support user-specified annotations, inhibiting their utility. We developed MAAV– a system to Measure Air quality, Annotate data streams, and Visualize real-time PM2.5 levels – to explore how participants engage with an air quality system addressing these challenges. MAAV supports collecting data from multiple air quality monitors, annotating that data through multiple modalities, and sending text message prompts when it detects a PM2.5 spike. MAAV also features an interactive tablet interface for displaying measurement data and annotations. Through six long-term field deployments (20-47 weeks, mean 37.7 weeks), participants found these system features important for understanding the air quality in and around their homes. Participants gained new insights from between-monitor comparisons, reflected on past PM2.5 spikes with the help of their annotations, and adapted their system usage as they familiarized themselves with their air quality data and MAAV. These results yield important insights for designing residential sensing systems that integrate into users’ everyday lives.
Publications
Exploring the Personal Informatics Analysis Gap: 'There's a Lot of Bacon'
Jimmy Moore, Pascal Goffin, Jason Wiese, Miriah Meyer
IEEE Transactions on Visualization and Computer Graphics (VIS), IEEE, 2021, pp. 95-105
An Interview Method for Engaging Personal Data
Jimmy Moore, Pascal Goffin, Jason Wiese, Miriah Meyer
Proc. ACM Interact. Mob. Wearable Ubiquitous Technol., vol. 5(4), Association for Computing Machinery, New York, NY, USA, 2021 Dec, pp. 1–28
Managing In-home Environments through Sensing, Annotating, and Visualizing Air Quality Data
Jimmy Moore, Pascal Goffin, Miriah Meyer, Philip Lundrigan, Neal Patwari, Katherine A. Sward, Jason Wiese
Proceedings of the ACM on Interactive, Mobile, Wearable and Ubiquitous Technologies archive, vol. 2(3), 2018 Aug 17